


When a client approached us with a React Native mobile application on the brink of release, they faced a critical challenge—severe performance issues. These issues threatened to derail the app’s launch and could lead to a poor user experience, potentially driving users away. To tackle this and to optimize the React Native app performance, Qubika’s App Solutions Studio conducted a thorough code analysis, performance testing, and devised a proposal to optimize the app’s performance.
We began by analyzing the codebase, focusing on the overall structure, adherence to best practices, and the efficiency of the existing state management. This initial analysis helped us identify key areas that were contributing to the performance bottlenecks.
Before diving into performance testing, we evaluated several tools for their ability to integrate seamlessly with our project and provide detailed insights. We chose Flipper, React Native Flipper Performance Monitor, and React DevTools due to their robust features and ease of use in identifying specific performance bottlenecks.
When you use an app, you expect it to be fast, responsive, and smooth. If your app has performance issues, such as slow rendering or unnecessary re-renders, users may experience lag, slow load times, or even app crashes. By identifying and fixing these issues, you can ensure a smoother and faster user experience.
One important tool to ensure this is performance monitoring, which helps us understand how well the app is running and identify any issues that might cause it to slow down or become unresponsive. Another one is React DevTools, that allows us to identify unnecessary re-renders, what things are causing them, and fix them.
What is Flipper?
Flipper is a platform for debugging iOS, Android and React Native apps. You can visualize, inspect, and control your apps from a simple desktop interface. In addition to using the tools already included, you can create your own plugins to visualize and debug data from your mobile apps, or install other available plugins on the platform.
What is the React Native Flipper Performance Monitor?
React Native Flipper Performance Monitor is a Flipper plugin specifically focused on monitoring an app’s performance on different scenarios. While this tool measures several key variables and graphs, we are going to focus on understanding the following:
- JavaScript Frames Per Second (JS FPS)
- User Interface Frames Per Second (UI FPS)
- Average Performance Percentage
- JavaScript Thread Lock (JS Thread Lock)
We’ll break down what these mean in simple terms and why they matter.
Understanding JavaScript FPS
JavaScript FPS (JS FPS) measures how efficiently the app’s code is running. Think of FPS as how quickly your app can update the screen. The higher the frames per second, the smoother and more responsive your app feels. When JavaScript FPS is high, it means the app’s code is running efficiently, and the app is responsive. If it’s low, you might notice the app feels sluggish or stutters, which can be frustrating for users. The maximum amount of JS frames per second is 60.
Understanding UI FPS
User Interface FPS (UI FPS) measures how smoothly the app’s user interface (what you see and interact with) is rendered on the screen. Just like in movies or video games, where a higher FPS means smoother motion, the UI FPS determines how fluidly the app’s animations and transitions appear. High UI FPS means that scrolling through the app, opening menus, and other visual interactions look and feel smooth. If the UI FPS is low, these interactions might seem choppy, which can make the app feel less polished and professional. The maximum amount of UI frames per second is 60.
Understanding average performance percentage
Average performance percentage is a general measure of how well the app is performing overall, considering both JS and UI FPS. It’s like getting an overall grade for the app’s performance. This percentage gives developers a quick idea of how well the app is running as a whole. If the average performance percentage is high, it means the app is doing well across the board. If it’s low, developers know there are areas that need improvement.
The next image shows how the average performance percentage is calculated.

Understanding JavaScript Thread Lock
JavaScript Thread Lock occurs when the JavaScript thread—the part of the app that handles most of the logic and communication—gets stuck or is “locked” by a task that takes too long. When this happens, other parts of the app can’t do their jobs, which might cause the app to freeze or become unresponsive. The JS thread is crucial because it handles many of the app’s core functions. If the thread is locked for too long, it can cause the app to freeze, leading to a poor user experience.
Summary
JS FPS ensures the app’s brain (the code) is working quickly, UI FPS ensures the app’s face (what you see) is smooth and beautiful, Average Performance Percentage is like the overall health checkup for the app, and JavaScript Thread Lock is a warning sign that something needs attention. Together, these metrics help us create the best possible experience.
What is React DevTools?
React DevTools has both a desktop version that you can connect directly to your application or a Flipper Plugin that you can set up through Flipper. This tool allows you to inspect and debug React components in an application. It provides detailed insights into the structure and behavior of your components, helping you optimize your app’s performance.
The Profiler is a feature in React DevTools that allows you to record the performance of your app. This way you can identify slow components and unnecessary re-renders, giving you the insights needed to optimize your app’s performance.
Our proposal to optimize React Native app performance
We understood that the process should be an iterative process, where the initial objective should be to focus on the general performance of the application. Let’s go through what the first iteration of the proposal looked like in regards to the problems we identified and the main suggested improvements.
- Refactor Main Components: To reduce unnecessary re-renders, we proposed refactoring the root structure of the application. This mainly meant moving and changing the logic from the root structure into smaller components. Most of this logic was causing re-renders in the root components, which caused re-renders of the entire application, so by moving it into other smaller components we managed to eliminate unnecessary re-renders, resulting in smoother user interactions.
- Eliminate Global Variables: By removing global variables and using state management solutions like Redux and Context API, we ensured better state management and reduced the potential for performance bottlenecks.
- Optimize Redux Store: We suggested breaking down large reducers and minimizing variable usage to streamline data handling within the app.
- Batch Redux Dispatches: Consolidating multiple independent Redux dispatches into batch operations helped reduce the number of re-renders, resulting in a more responsive UI.
- Replace AsyncStorage: We recommended moving critical data management from direct AsyncStorage calls to Redux, and introduced a more efficient persistence tool to handle storage operations, significantly improving performance.
The results of optimization
After implementing the suggested improvements, we tested the performance on different scenarios. Let’s take a look at the following example. When the users entered the application, the performance monitor we talked about before showed that the app used to have an average performance of 61%, and we managed to increment it by 24%, making it to a 85% performance score.
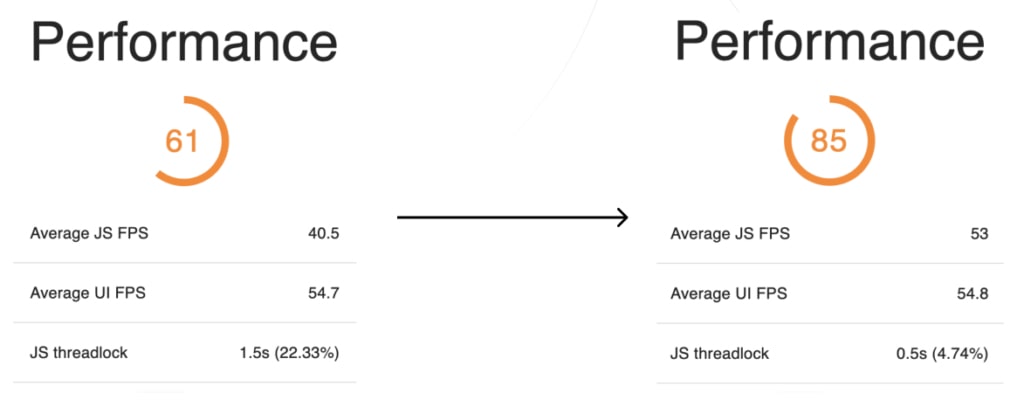
If we evaluate the average JS FPS, we can see that it incremented from 40.5 to 53 out of 60, which is a very significant improvement. The average UI FPS didn’t change much, but it was already at an acceptable value. When looking at the JS thread lock variable, we can see that we reduced it to a third, making it to half a second, instead of a second and a half.
So in only a month of work, we managed to improve performance by around 20% in every scenario, and decrease at least to half every JS Threadlock found.
Summary of optimizing React Native app performance
When our client approached us with a React Native mobile application on the brink of release, they faced a significant challenge—severe performance issues that threatened the app’s success. Through a comprehensive approach involving code analysis, performance testing, and targeted optimizations, we were able to significantly optimize the React Native app’s performance.
Our optimization proposal included refactoring main components to reduce unnecessary re-renders, eliminating global variables, optimizing the Redux store, and improving data persistence by replacing AsyncStorage. These steps led to substantial performance improvements, particularly in the app’s average performance and JS FPS.
The results were compelling. Post-implementation testing showed a 20% increase in overall performance in every tested scenario. Additionally, the JavaScript Thread Lock time was reduced to at least half of initial values, contributing to a much smoother user experience.
Optimizing the performance of a React Native mobile application is crucial for delivering a seamless user experience – learn more about the work of Qubika’s App Solutions Studio here.