


This post is Part 4 of a 5-part series on cost-aware architecture in Databricks, published by Qubika. In this series, we share how our teams make architectural and compute decisions with cost-efficiency in mind, without sacrificing speed, flexibility, or maintainability.
Series Overview:
| Part | Title | Status |
|---|---|---|
| 1 | Cost-First Design | Published: read here |
| 2 | Serverless vs Classic Compute | Published: read here |
| 3 | DLT, Monitoring & Photon | Published: read here |
| 4 | From Design to Numbers | →Your are here |
| 5 | Cost Governance in Practice | Published here |
Why Estimation Matters: Cost Predictability = Trust
Great design isn’t enough. Stakeholders (from engineers to finance) need to know how much a pipeline or workload will cost. The goal of this post is to turn architectural choices into defendable cost estimates that hold up in real-world usage.
This is where most Databricks cost guidance falls short. It tells you how much a DBU costs, but not how to go from “I have 10 tables to process daily” to “my estimated monthly bill is $1,200 ±15%.”
We fix that here.
The Full Cost Model: Beyond Just DBUs
Too many teams underestimate costs by only considering compute. But real Databricks costs are layered:
-
DBUs (by SKU: Jobs, All-Purpose, DLT, SQL, Model Serving)
-
Cloud VM cost (only for classic compute)
-
Storage (Delta tables, Checkpoints, Monitoring metrics, Artifacts)
-
Network (egress, NAT, cross-region traffic, logs)
-
AI/ML Premium Features (e.g., Vector Search, Agents, Embeddings)
-
Operational Overhead (engineering time to manage clusters, tagging, governance)
📌 Include all of them in your model.
We recommend visualizing this as a stacked chart. For inspiration, see [Part 3’s breakdown of DLT + Monitoring costs] and our blog on system tables for tracking real usage.
Estimation Framework: Inputs → Logic → Outputs
A solid estimate starts with the right inputs. We use a framework inspired by RFP intake forms, adapted to Databricks:
Must-have inputs:
-
Volume of data (initial TB + monthly growth)
-
Processing frequency (batch, streaming, hourly, daily?)
-
Change rate (% daily changes for incremental jobs)
-
SLA (latency, freshness, window)
-
Concurrency (jobs/users/queries in parallel)
-
Workload type (SQL-heavy, Spark, ML, Serving)
-
Runtime dependencies (libraries, internet access, init scripts)
-
Region and cross-region considerations
-
Number of environments (dev/stg/prod) and active hours
From here, use scenario-based modeling:
-
Benchmark 1–3 real jobs (small sample runs).
-
Extrapolate based on volume/frequency.
-
Multiply by DBU rate and other cost layers.
-
Add buffer (e.g. ±20%) for variability.
Present the output in a 3-tier model:
|
Scenario |
Est. Monthly DBUs |
Infra Cost |
Total Est. $ |
|---|---|---|---|
|
Low-load |
250 |
$100 |
$300 |
|
Expected |
480 |
$180 |
$580 |
|
High-growth |
720 |
$250 |
$850 |
Note: These estimates are illustrative and based on public DBU pricing at the time of writing. Your actual costs may vary depending on region, pricing tier, and infrastructure choices.
Use the Databricks Pricing Calculator or consult your cloud provider console for the most accurate pricing.
Monitor with System Tables (Reality Check)
Even the best estimates are only as good as the feedback loop. Once your workloads run, monitor usage with system tables:
Use:
-
system.billing.usage→ Track DBUs per SKU, workspace, tag -
system.compute.clusters→ Runtime type, Photon, cluster config -
system.access.audit→ Who’s triggering workloads, how often
See our full walkthrough in this post: Understanding Databricks Costs Through System Tables
Make it part of your FinOps or platform team practice to audit costs weekly, catch misconfigured jobs, and flag unused compute.
Example: Turn a Pipeline into an Estimate
Imagine you’re asked: “How much will our daily customer churn pipeline cost?”
You gather:
-
50 GB input daily
-
Incremental load (~5% daily change)
-
SLA: 30-minute latency
-
Runs hourly
-
Uses a DLT Core pipeline + Lakehouse Monitoring
-
Region: us-west, single workspace
You run a pilot and see:
-
Each run processes ~3 GB
-
DLT adds 20% DBU overhead
-
Monitoring adds 5 DBUs/day
-
Photon cuts job runtime by 40%
Resulting estimate:
-
24 runs/day × 3 GB = 72 GB/day
-
Runtime per run = 4 min (with Photon)
-
Monthly DBU: ~350 (job) + 100 (DLT overhead) + 150 (Monitoring)
-
Total est. cost: ~$520/month (±15%)
Note: Estimated cost is based on DBU usage and service assumptions. Always validate using real usage via system tables and confirm unit pricing in the Databricks Pricing Calculator or your enterprise agreement.
Final Thoughts
A cost-aware architecture doesn’t stop at design. It means translating ideas into realistic numbers, and tracking them continuously.
Cost estimation is a loop:
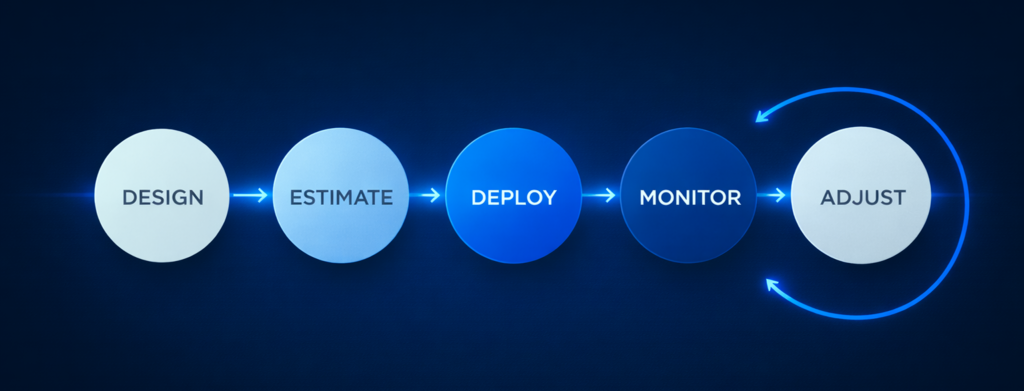
When that loop is tight, Databricks becomes a cost-efficient powerhouse, not a surprise line item. Part 5 will close the loop with how to set up dashboards, do benchmarks, and run governance.
Publishing soon → Read Part 5: Cost Governance in Practice:Benchmarks, Dashboards and Tagging