


When Exporting to BI Tools Slows You Down
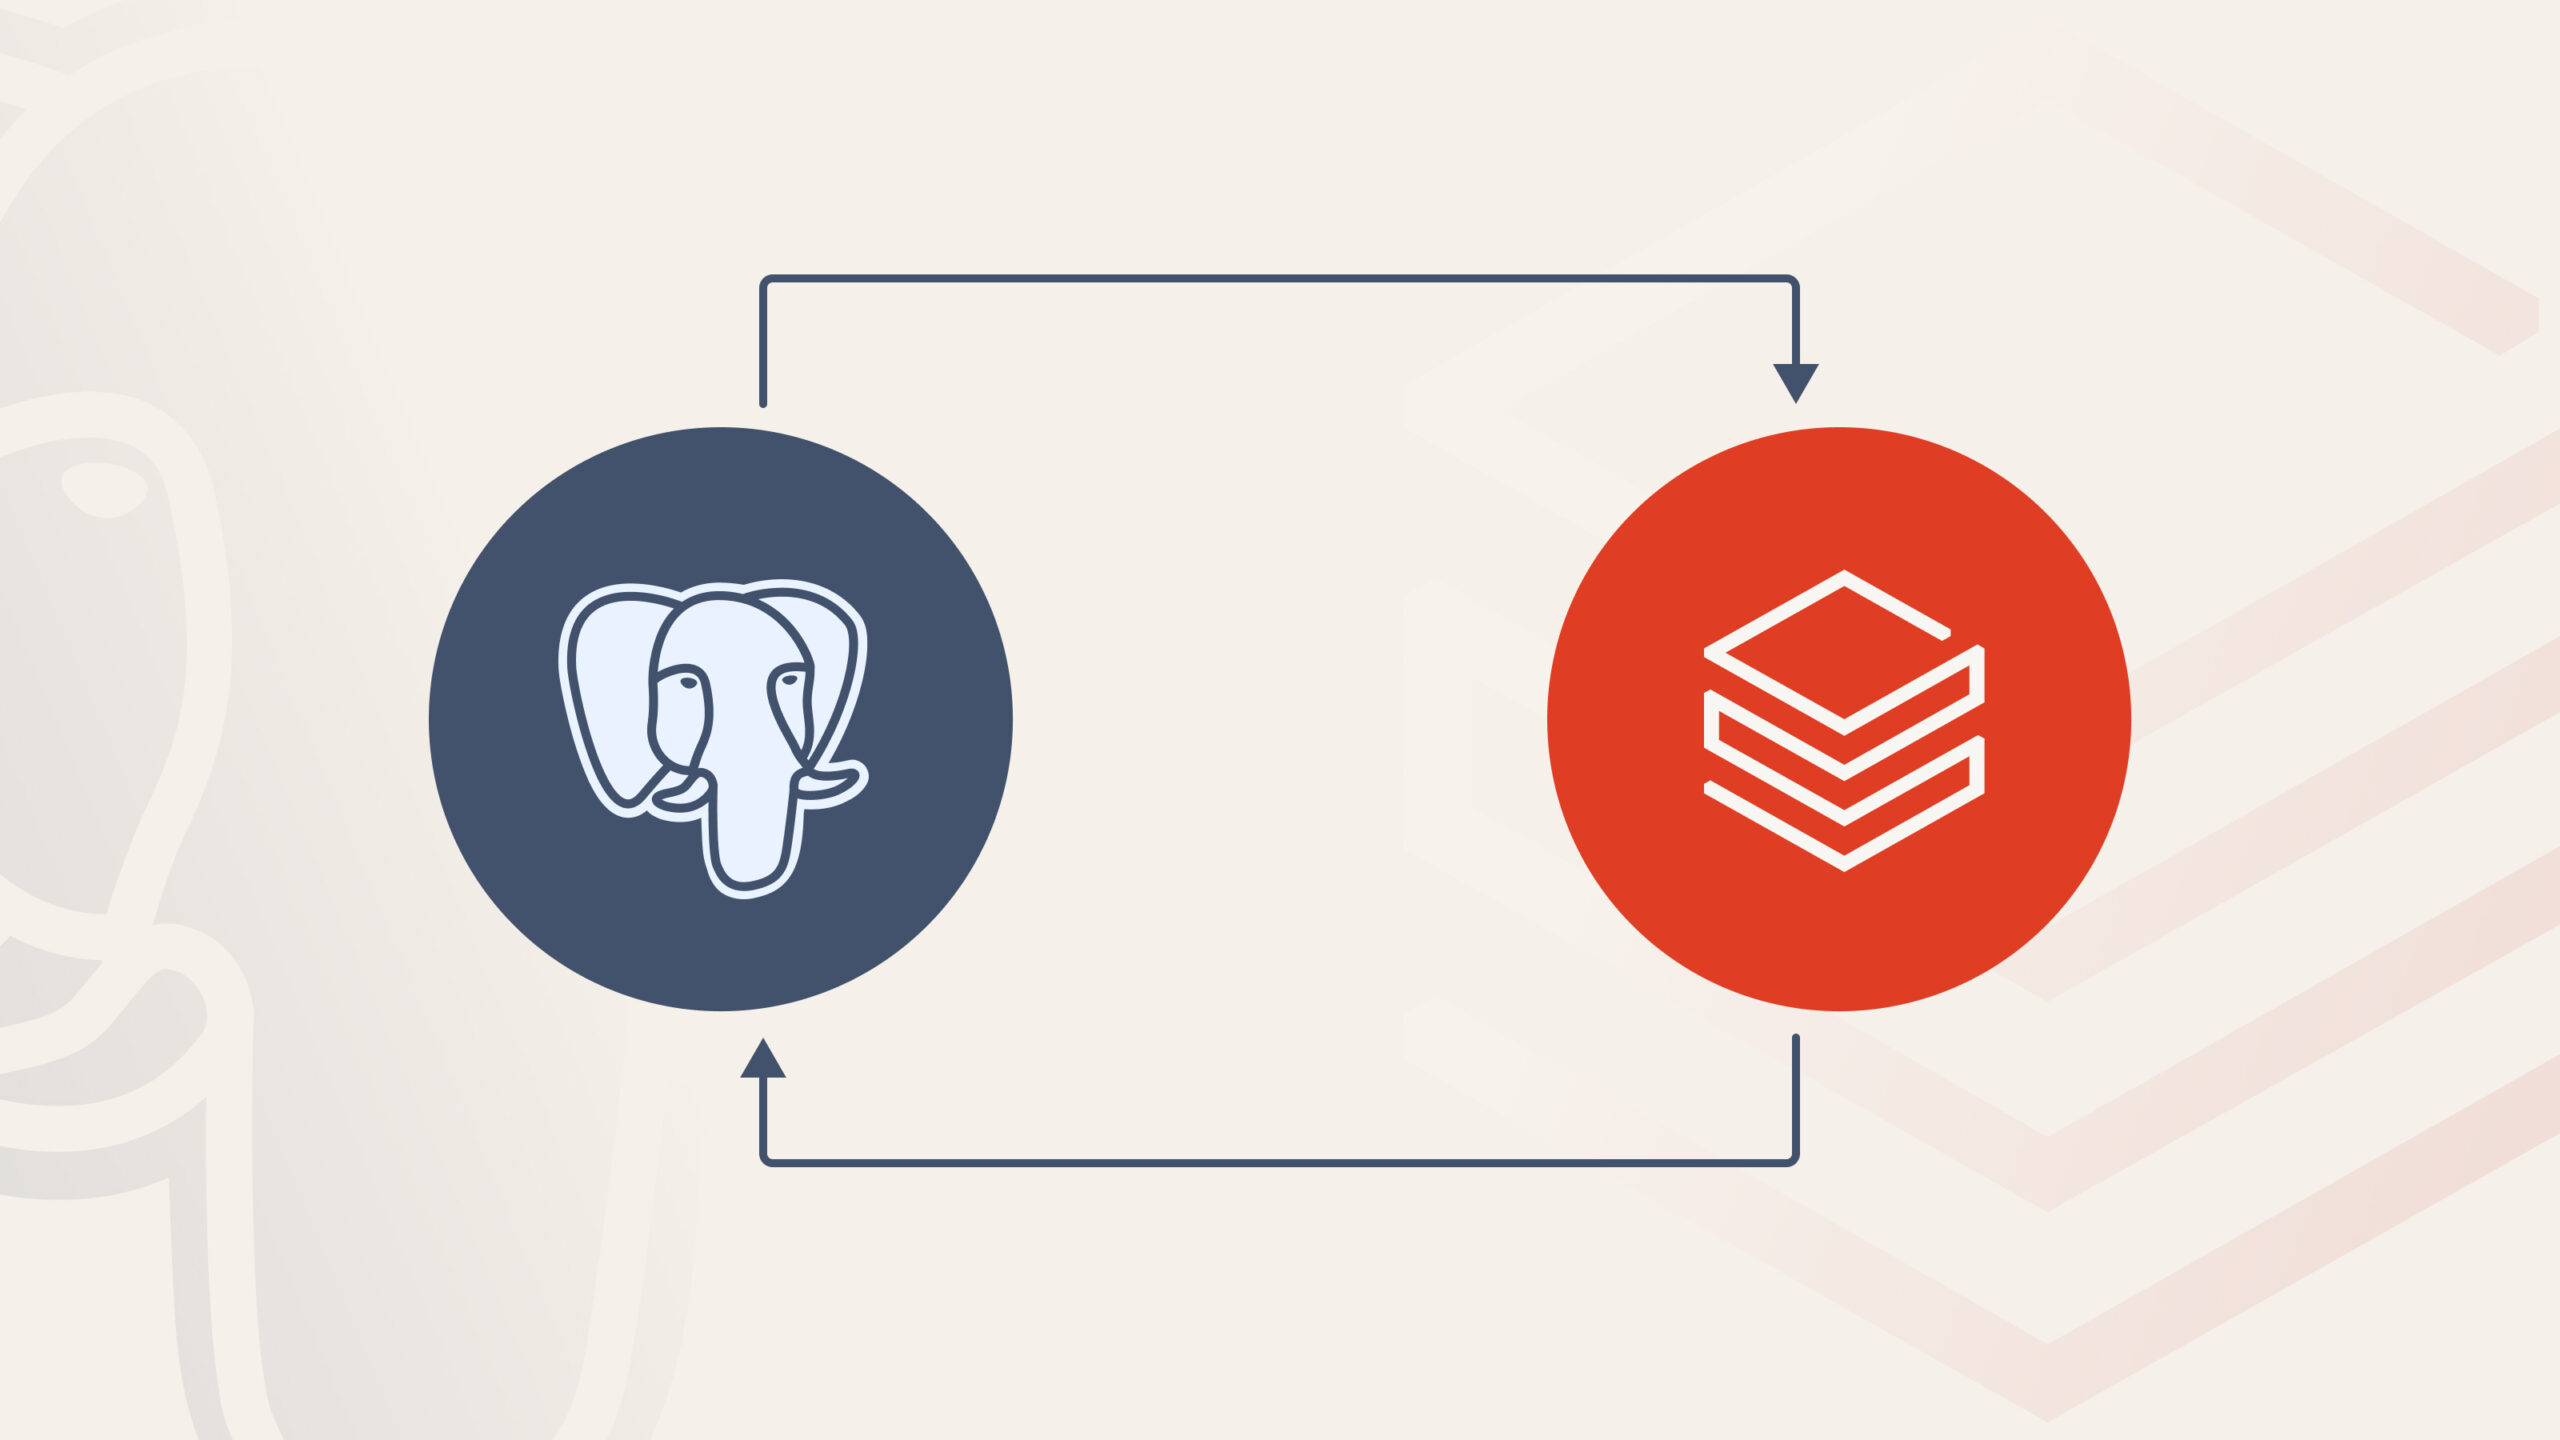
There’s a familiar pattern in data teams:
-
Build transformations in the Lakehouse
-
Validate results in SQL
-
Export data to a BI tool
-
Rebuild logic again
-
Maintain two versions of the truth
That duplication creates friction:
-
Metrics drift
-
Governance inconsistencies
-
Performance bottlenecks
-
Increased operational cost
Databricks Dashboards take a different approach:
you visualize directly on top of the Lakehouse, without moving the data anywhere else.
At Qubika, we often use them as data‑native visualization interfaces, lightweight, fast, using data directly from gold data layers, without needing to export data from your platform and duplicate your source of truth.
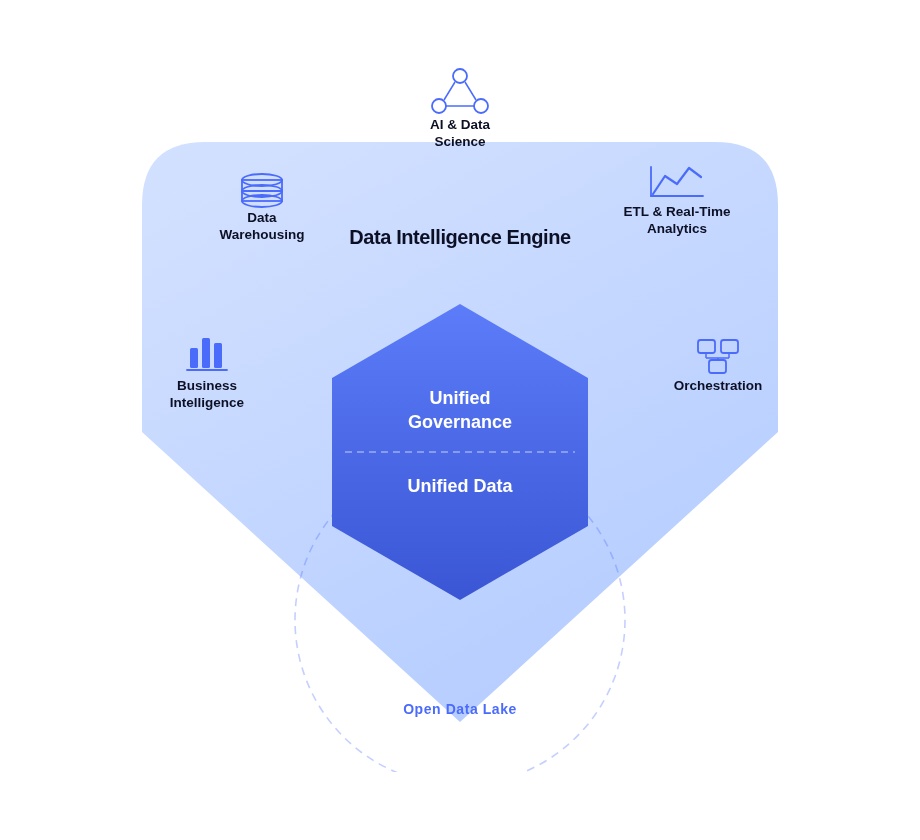
What Databricks Dashboards Actually Are
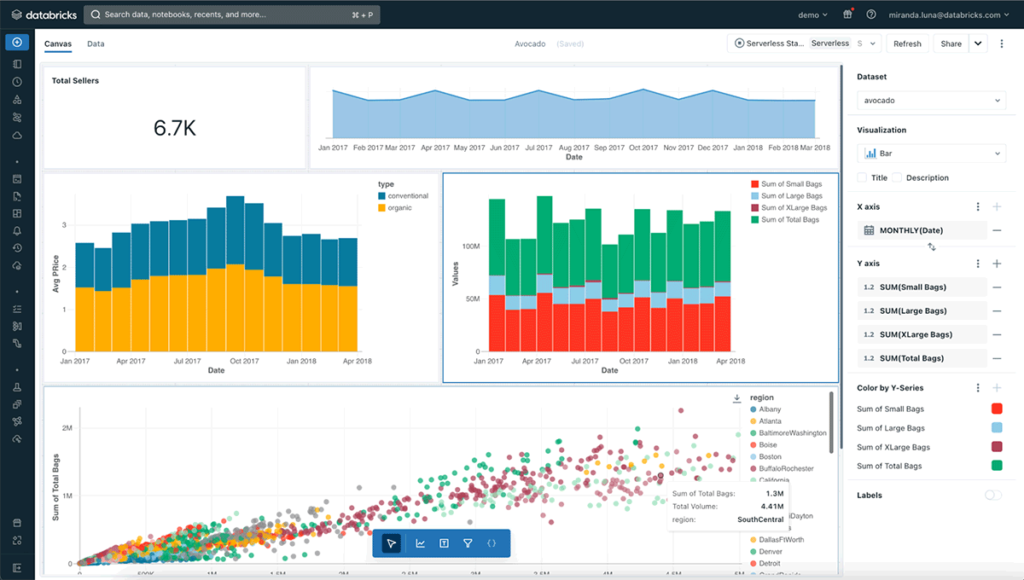
Databricks Dashboards are a native visualization layer built directly into the platform.
They run on:
-
SQL queries executed on SQL Warehouses
-
Delta tables stored in the Lakehouse
-
Unity Catalog governance rules
Dashboards are designed to enable analysis and operational monitoring directly inside Databricks , without requiring external BI tooling.
This means:
-
No data duplication
-
No external semantic layer
-
No additional integration layer
-
Governance stays centralized
They are entirely SQL-driven and built for proximity to the data.
Why Teams Use Them
Dashboards inside Databricks shine when speed, control, and simplicity matter more than advanced storytelling.
Immediate insight over business aggregated datasets
When data already lives in Silver or Gold layers, teams can build visualizations instantly using SQL.
-
No model replication.
-
No need for DAX or other data transformation languages.
Governance stays intact with Unity Catalog
Permissions are enforced through Unity Catalog.You can choose whether viewers access data via:
-
Shared credentials (simpler)
-
Individual credentials (more secure)
This dual model allows flexibility depending on isolation requirements.
Low-latency performance
Because data does not move outside the Lakehouse, latency is minimal.
Performance depends on:
-
Query design
-
Warehouse sizing
-
Table optimization
But when properly tuned, response times are excellent, especially for curated datasets.
Operational simplicity
Low infrastructure overhead.
Version control via Git.
Embedding support through iframe when needed
For internal technical consumption, the setup is extremely efficient.
Where Databricks Dashboards Fit Best
From our experience at Qubika, Databricks Dashboards work best as a data-native visibility layer built directly on top of business aggregated Lakehouse data. Some possible use cases include:
Operational & Platform Visibility
They are naturally strong for monitoring use cases tightly connected to the data platform:
-
Data quality and SLA tracking
-
Pipeline performance and ingestion monitoring
-
Deployment impact validation
-
Near-real-time operational metrics
Curated Business Metrics
When business definitions are already standardized in Gold tables, dashboards become a lightweight reporting surface for:
-
Revenue and financial tracking
-
Product and growth analytics
-
Funnel performance
-
Retention and engagement metrics
Internal Reporting & Embedded Analytics
With publishing controls and embedding capabilities, dashboards can support:
-
Department-level reporting
-
Internal analytics portals
-
Admin or back-office control panels
-
Technical leadership reviews
Practical Design Guidelines We Apply in Real Projects
Here’s where many teams make mistakes. Dashboards inside Databricks are powerful , but only if built thoughtfully.
Choose the Right Compute
Use Serverless SQL Warehouses dedicated to dashboards.
Avoid all-purpose clusters.
Right-sizing matters:
-
Too small → queued queries
-
Too large → unnecessary cost
Autoscaling and auto-termination should always be configured to avoid undesired costs and performance issues.
Prefer Gold Tables
Dashboards should rarely depend on joined tables. Benefits from leveraging Gold tables will include:
-
Improve runtime
-
Guarantee metric consistency
-
Reduce query complexity
Balance Parameters and Filters
There’s a key distinction:
-
Query Parameters: filter at the warehouse level, rerun query
-
Visual Filters: applied in the browser
Parameters protect performance on large datasets.
Visual filters improve user experience.
Finding the right balance is critical in production dashboards.
Keep It Lean
Each widget triggers a query.
A tab with 20 visuals means 20 concurrent queries.
In real implementations, we aim for:
-
6–8 meaningful visuals per tab
-
Shared datasets across widgets
-
Simplicity over density
Databricks’ strength is in its backend engine , not in decorative design.
A Strategic Perspective
Databricks Dashboards are best understood as:
-
Fast to build
-
Governed by default
-
Cost-aware when configured correctly
-
Easy to maintain when models evolve
When the objective is proximity to data and technical clarity, they are extremely effective.
When the objective is executive storytelling, we extend into full BI platforms.
Final Thoughts
Modern data platforms don’t need one visualization tool, they need the right tool for the right layer.
Databricks Dashboards are not trying to compete with Power BI or Tableau.
They are solving something different:
-
Keep analytics close to the Lakehouse
-
Preserve governance
-
Reduce duplication
-
Enable rapid operational insight
Used with intention, they become a powerful component of a well-architected Databricks ecosystem.
Frequently Asked Questions
What are Databricks Dashboards?
Databricks Dashboards are a native SQL-driven visualization layer built directly into the Databricks platform. They run on top of Delta tables stored in the Lakehouse, execute queries via SQL Warehouses, and are governed by Unity Catalog — without requiring data to be exported to an external BI tool.
When should you use Databricks Dashboards instead of Power BI or Tableau?
Databricks Dashboards are best when speed, governance, and proximity to the data matter more than advanced storytelling. They are well suited for operational monitoring, pipeline performance tracking, and curated business metrics built on Gold tables. For executive-level storytelling or complex visual narratives, extending into a full BI platform like Power BI or Tableau is the better choice.
How do Databricks Dashboards handle governance?
Governance is enforced through Unity Catalog. Permissions can be applied using shared credentials for simpler access patterns or individual credentials for stronger isolation. This means the same governance model that applies to your data assets in the Lakehouse applies directly to what users see in dashboards.
What compute should Databricks Dashboards run on?
Serverless SQL Warehouses are the recommended choice. They minimize cold-start latency and simplify infrastructure management. Autoscaling and auto-termination should always be configured to control costs, and warehouses should be sized to match expected concurrency rather than peak assumptions.
What is the difference between query parameters and visual filters in Databricks Dashboards?
Query parameters filter data at the warehouse level and trigger a query rerun, which protects performance on large datasets. Visual filters are applied in the browser after the query runs, improving user experience without additional compute cost. Finding the right balance between the two is critical in production dashboard design.
Explore our Databricks services
Qubika is a Databricks Gold Partner with 200+ certified engineers across data, AI, and ML. Whether you're adopting Lakeflow, migrating existing pipelines, or designing a lakehouse from scratch, our team brings hands-on platform experience to every engagement.